

Sustainability Squared Consulting
Sustainability Consulting Services for Businesses in Sonoma County and Beyond
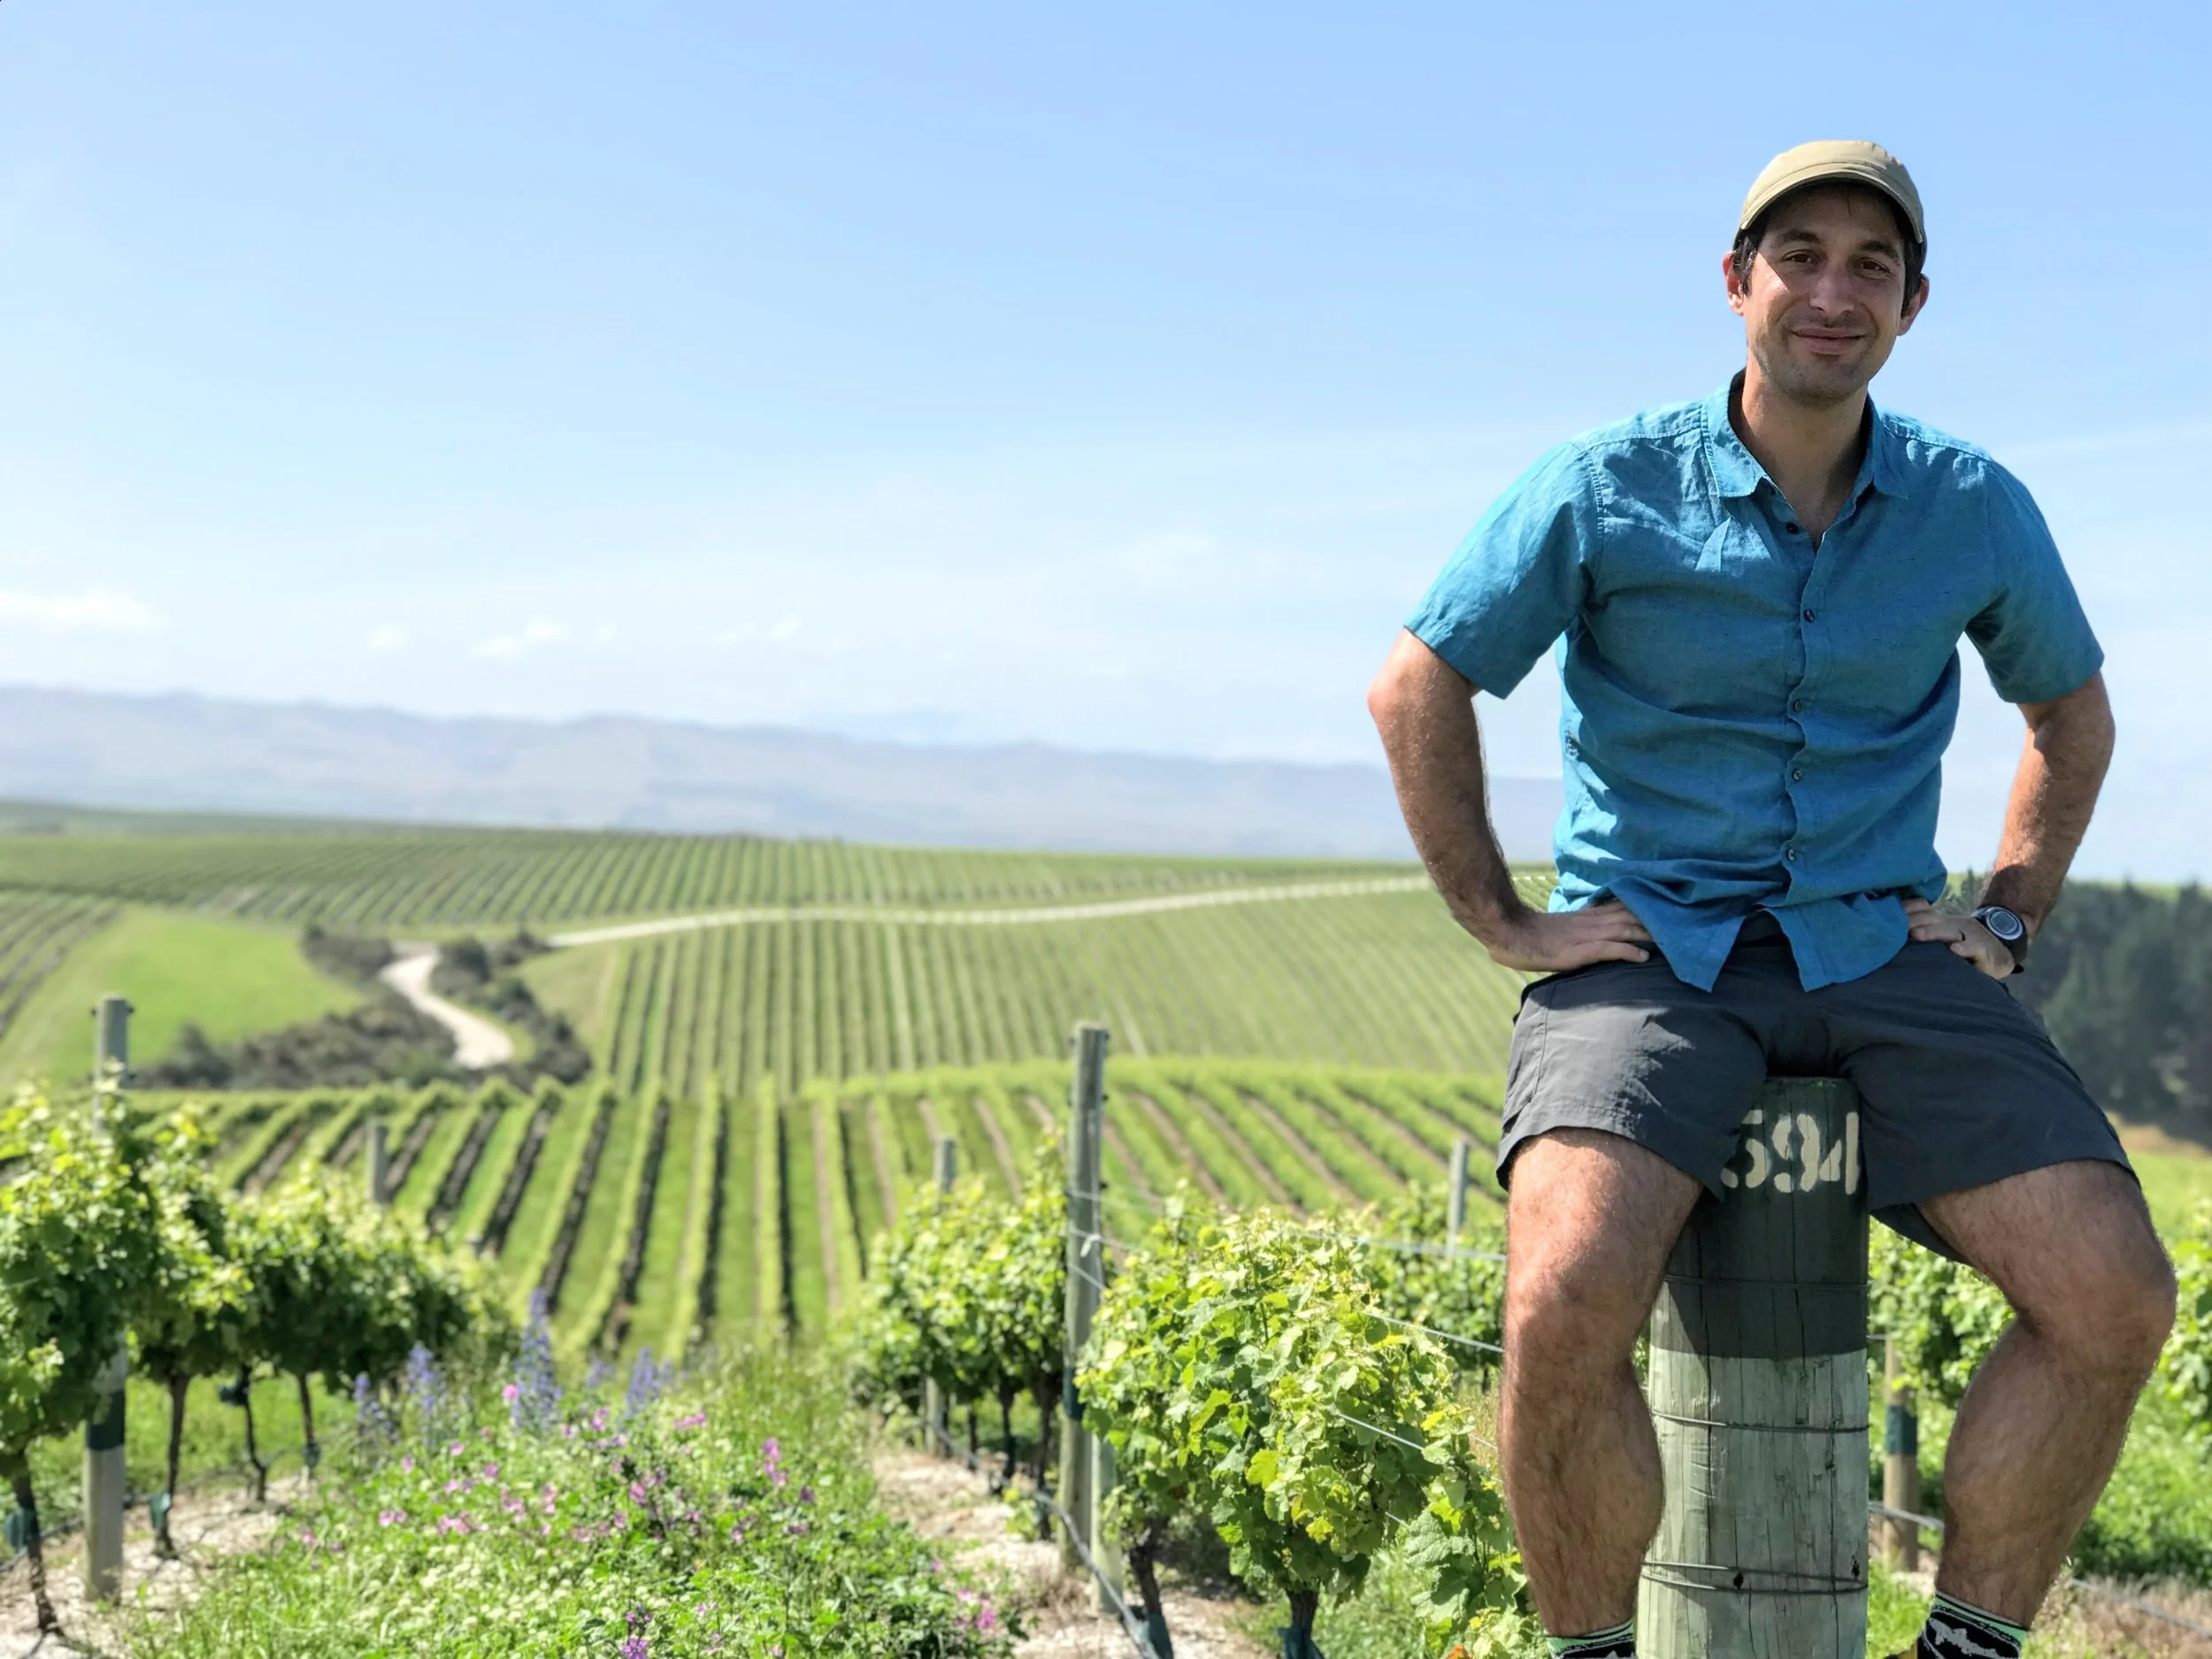
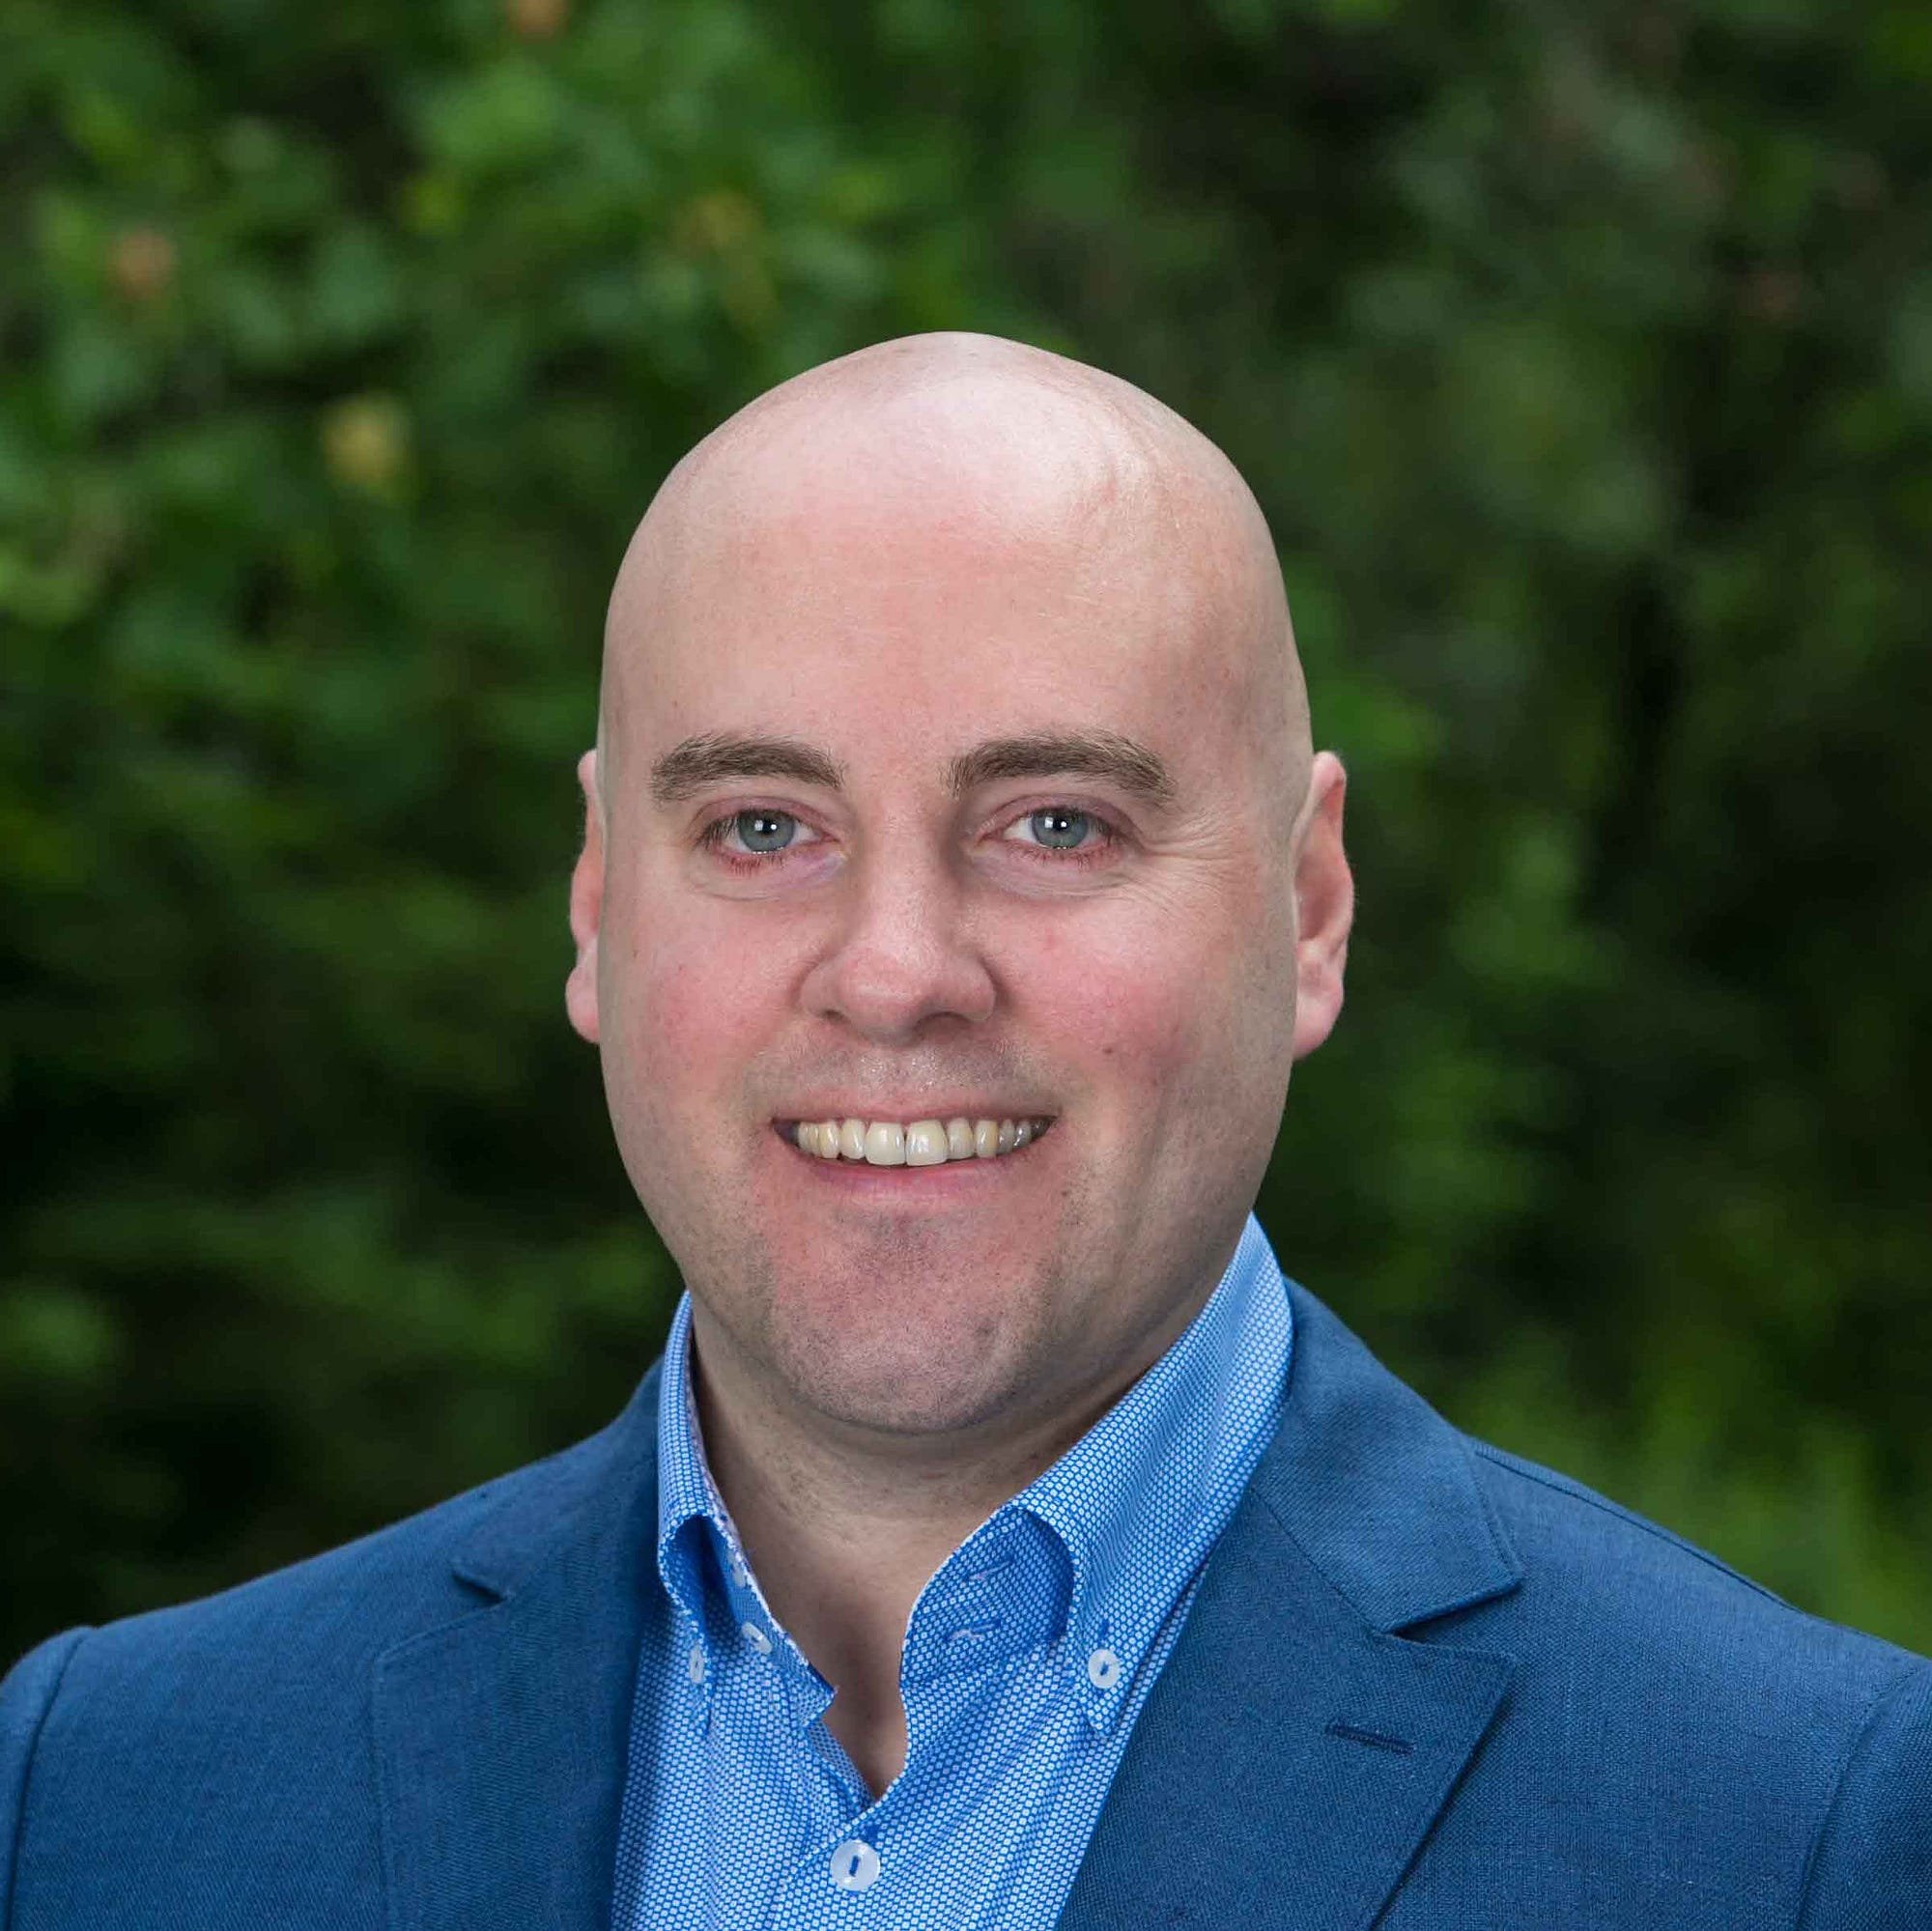
About Aaron

Strategic Sustainability Consultant
10+ years of experience in wine industry sustainability
Expertise in decarbonization, clean energy, water stewardship and business sustainability.
Proven track record of aligning sustainability goals with business objectives and delivering measurable results.
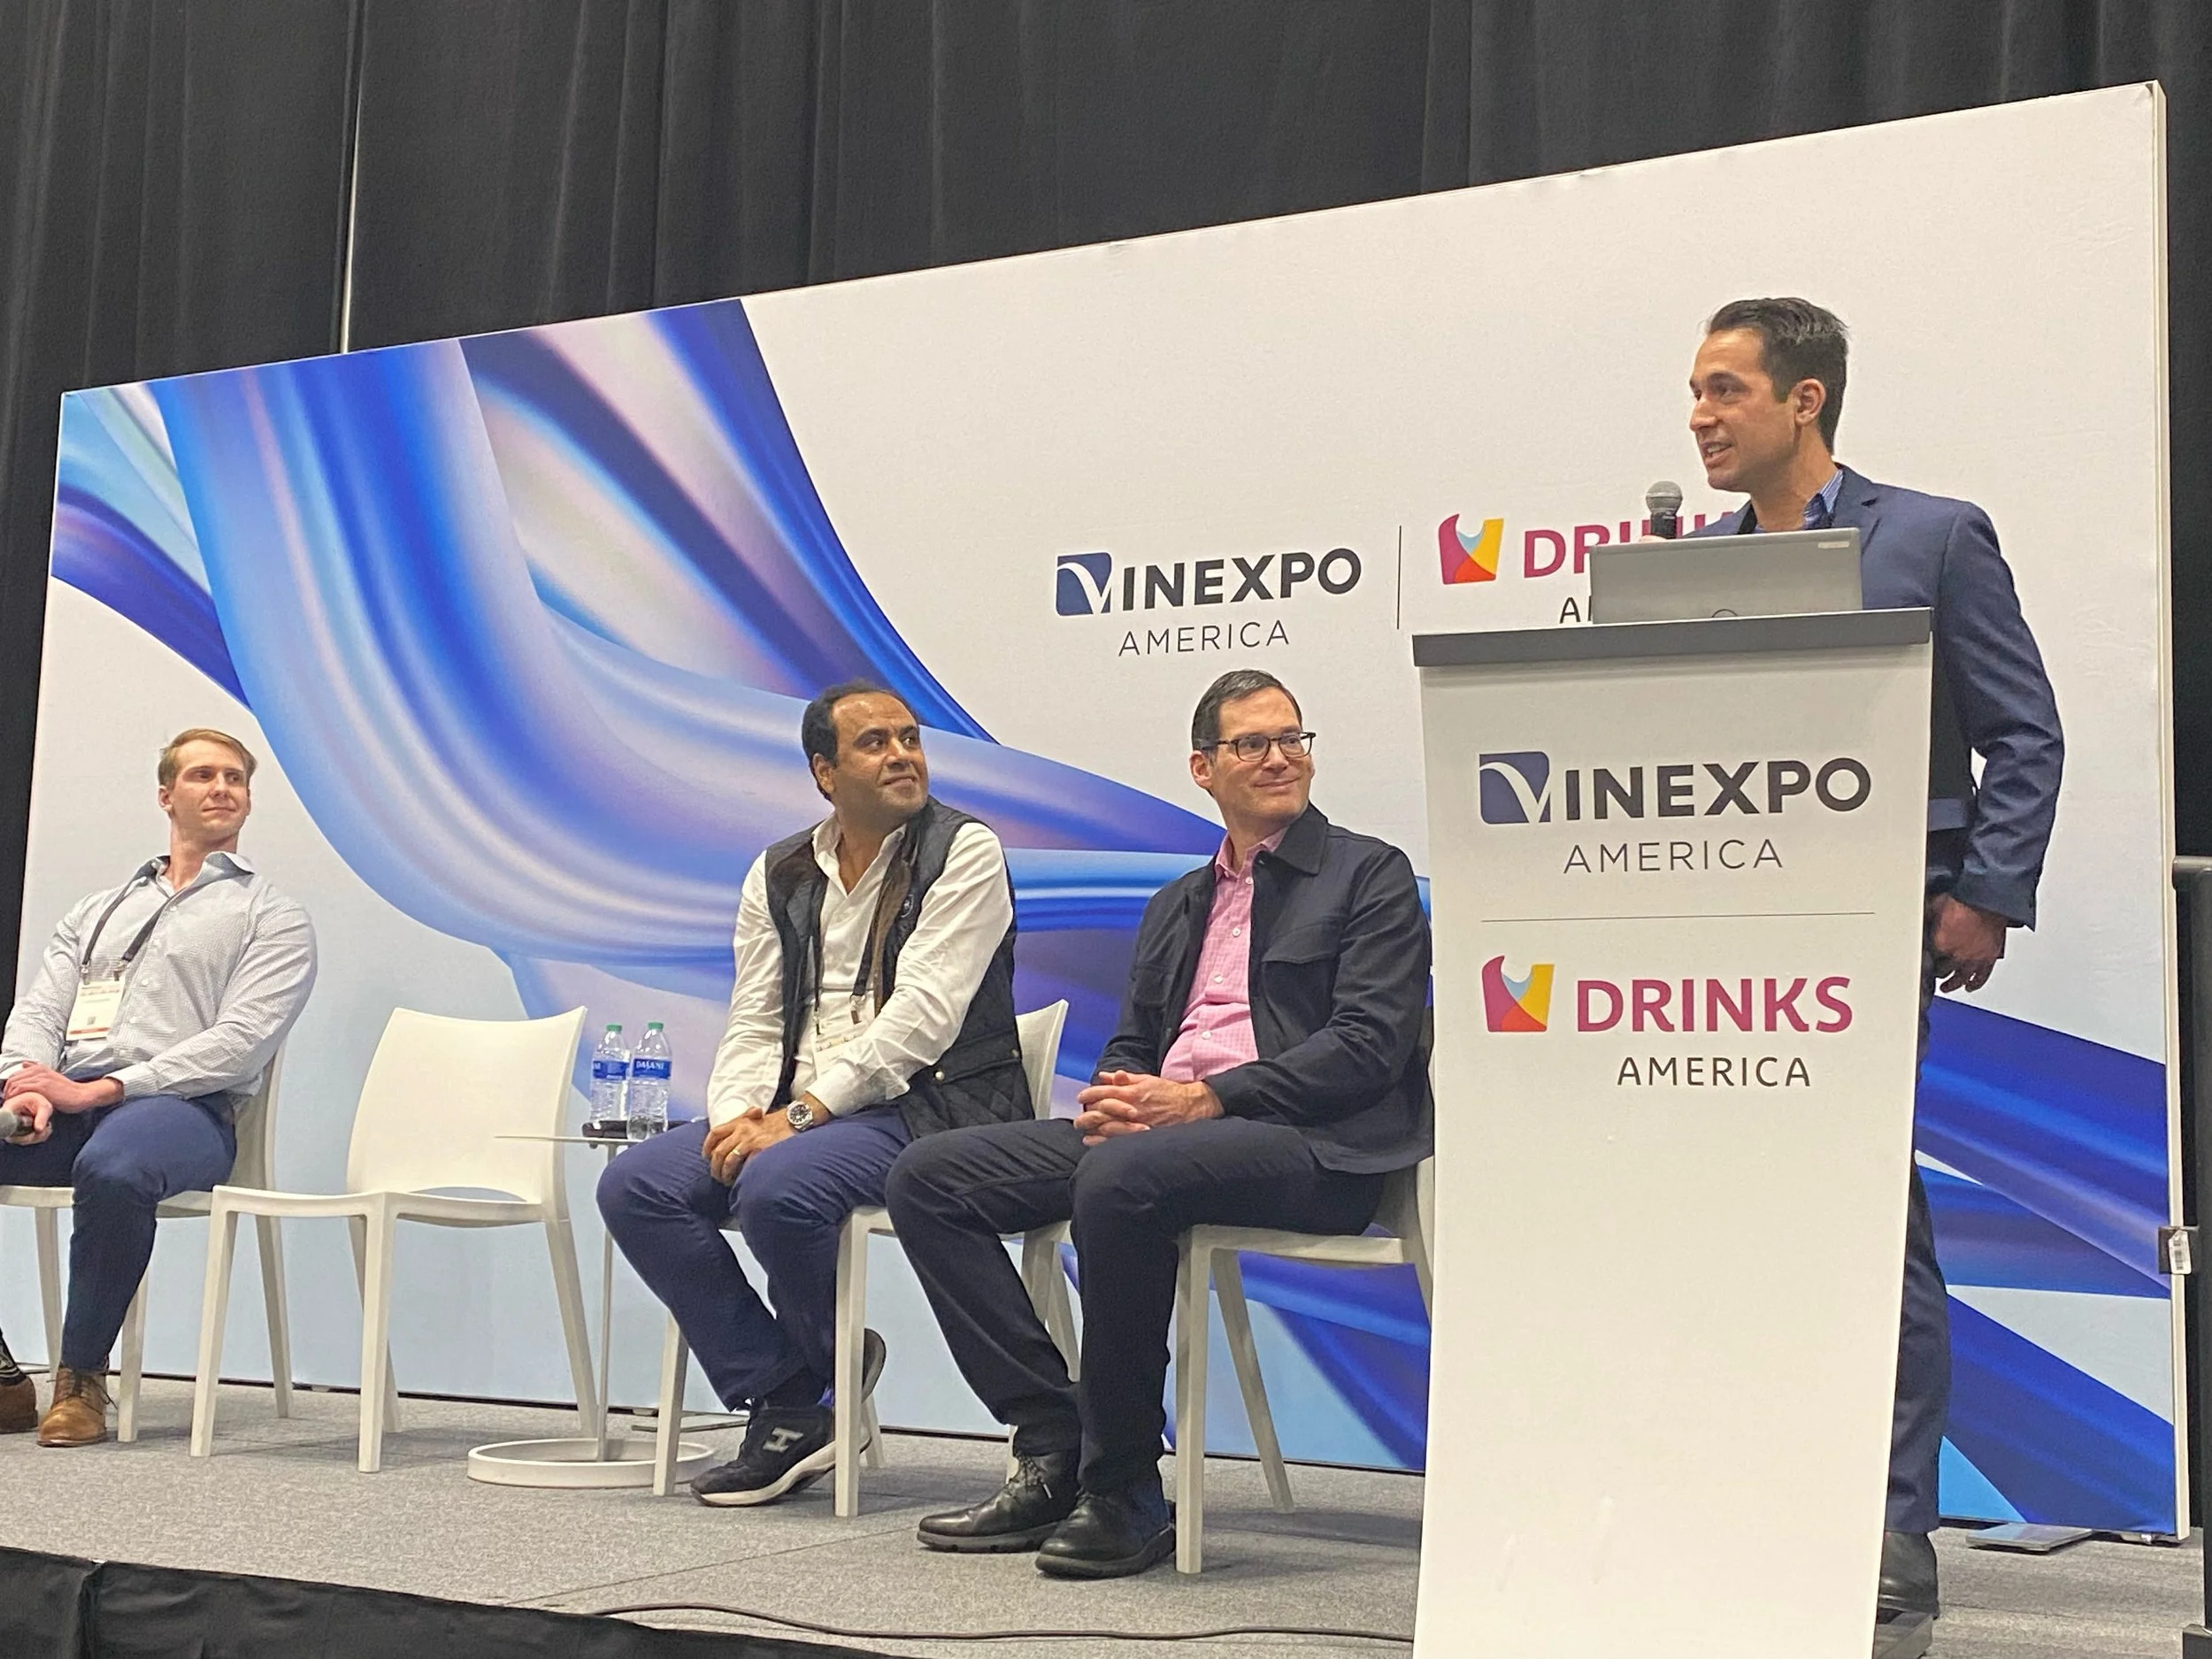
I’m Aaron—a strategic sustainability consultant dedicated to transforming ambitious environmental goals into measurable business results. For over a decade, I’ve specialized in wine industry sustainability—helping wineries and beverage brands embrace decarbonization, clean energy, water stewardship, regenerative farming, and efficiency as drivers of innovation and growth.
Beyond wine, I’ve partnered with beverage companies, tech firms, and custom projects to design solutions that meet unique sustainability challenges. My work spans governance, manufacturing efficiency, and even integrating sustainability into sales strategies—because real impact happens when sustainability is woven into every part of the business.
I’ve served on boards including The Climate Center, California Sustainable Winegrowing Alliance, and International Wineries for Climate Action. With an MS in Sustainability Management from Kogod School of Business and a BS from Northland College, I bring both expertise and creativity to every project.
When I’m not helping businesses reduce emissions, you’ll find me cycling through Sonoma County, gardening with my family, or exploring Northern California’s incredible landscapes.
Our Services
-
Operational Efficiency
Reduce waste and costs
-
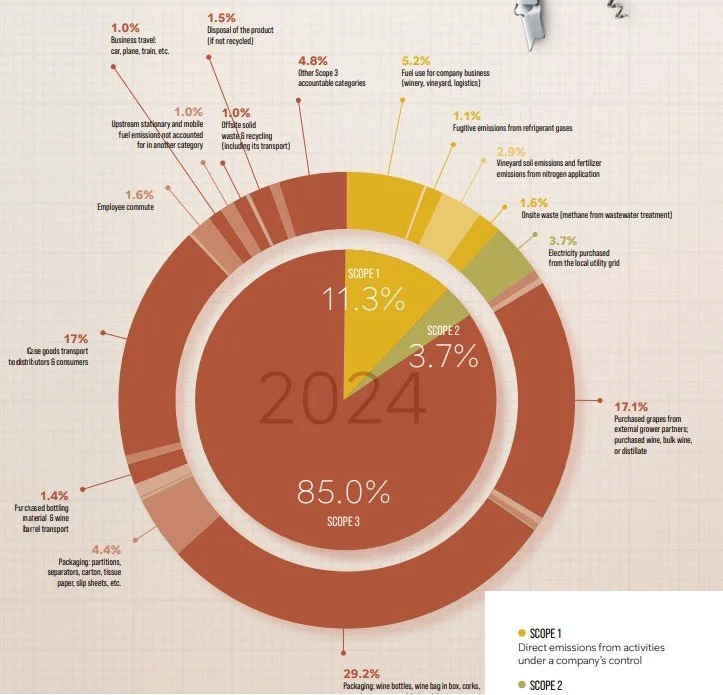
GHG Emissions Accounting
Build a clear emissions baseline
-
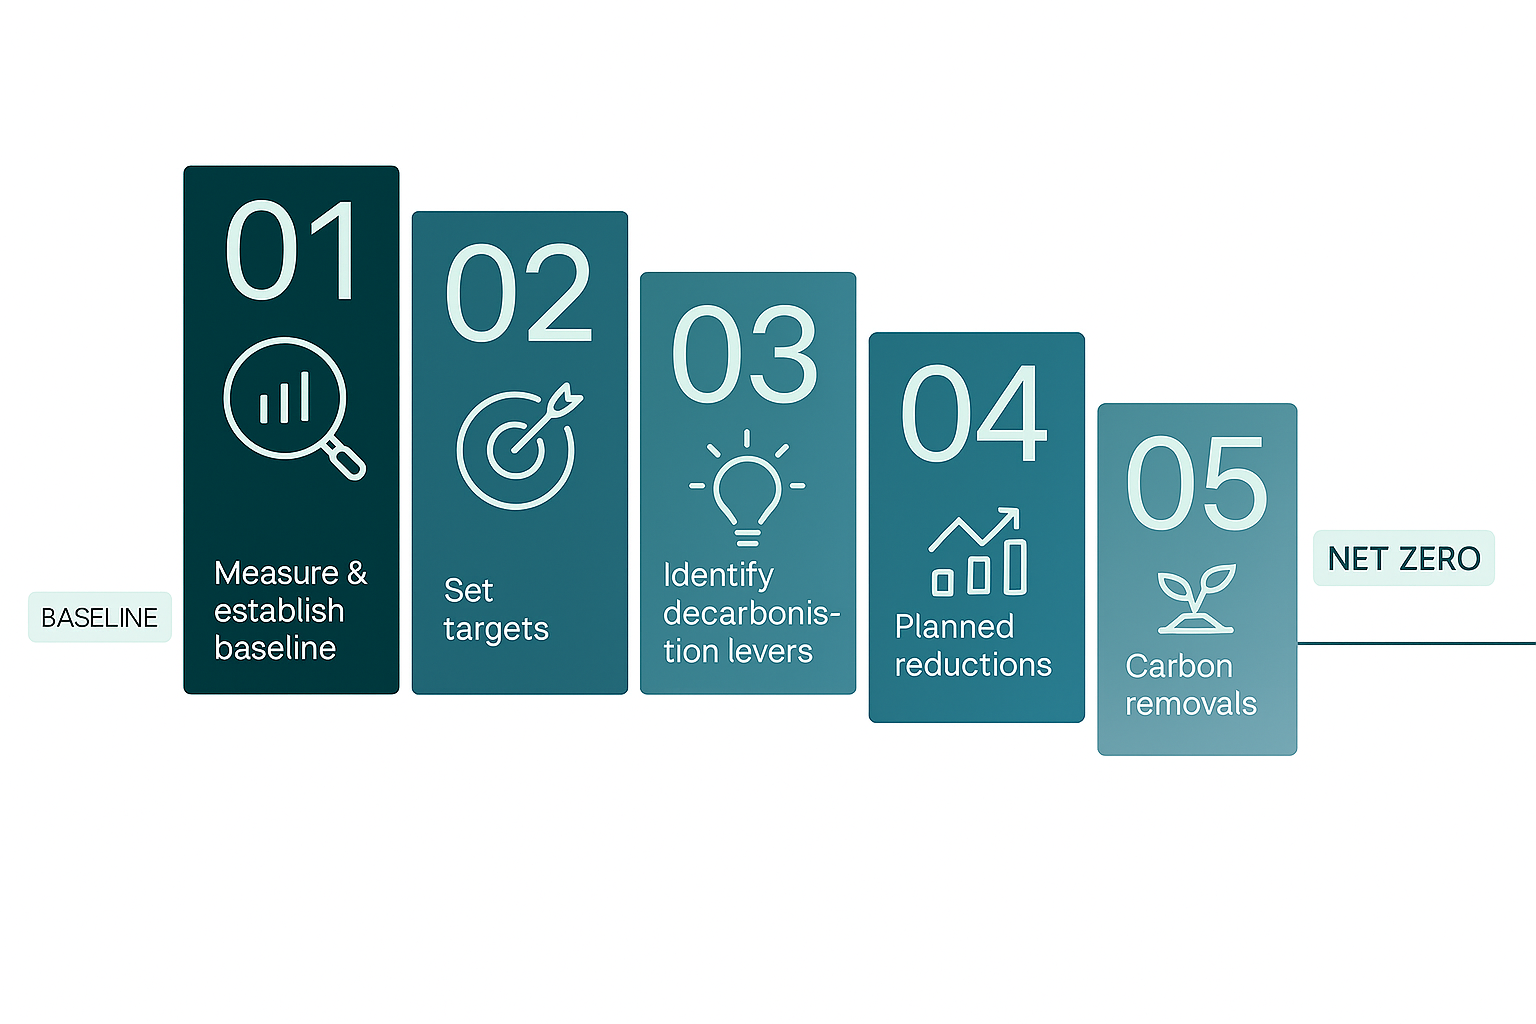
Decarbonization Planning
Set science-based targets and roadmaps.
-
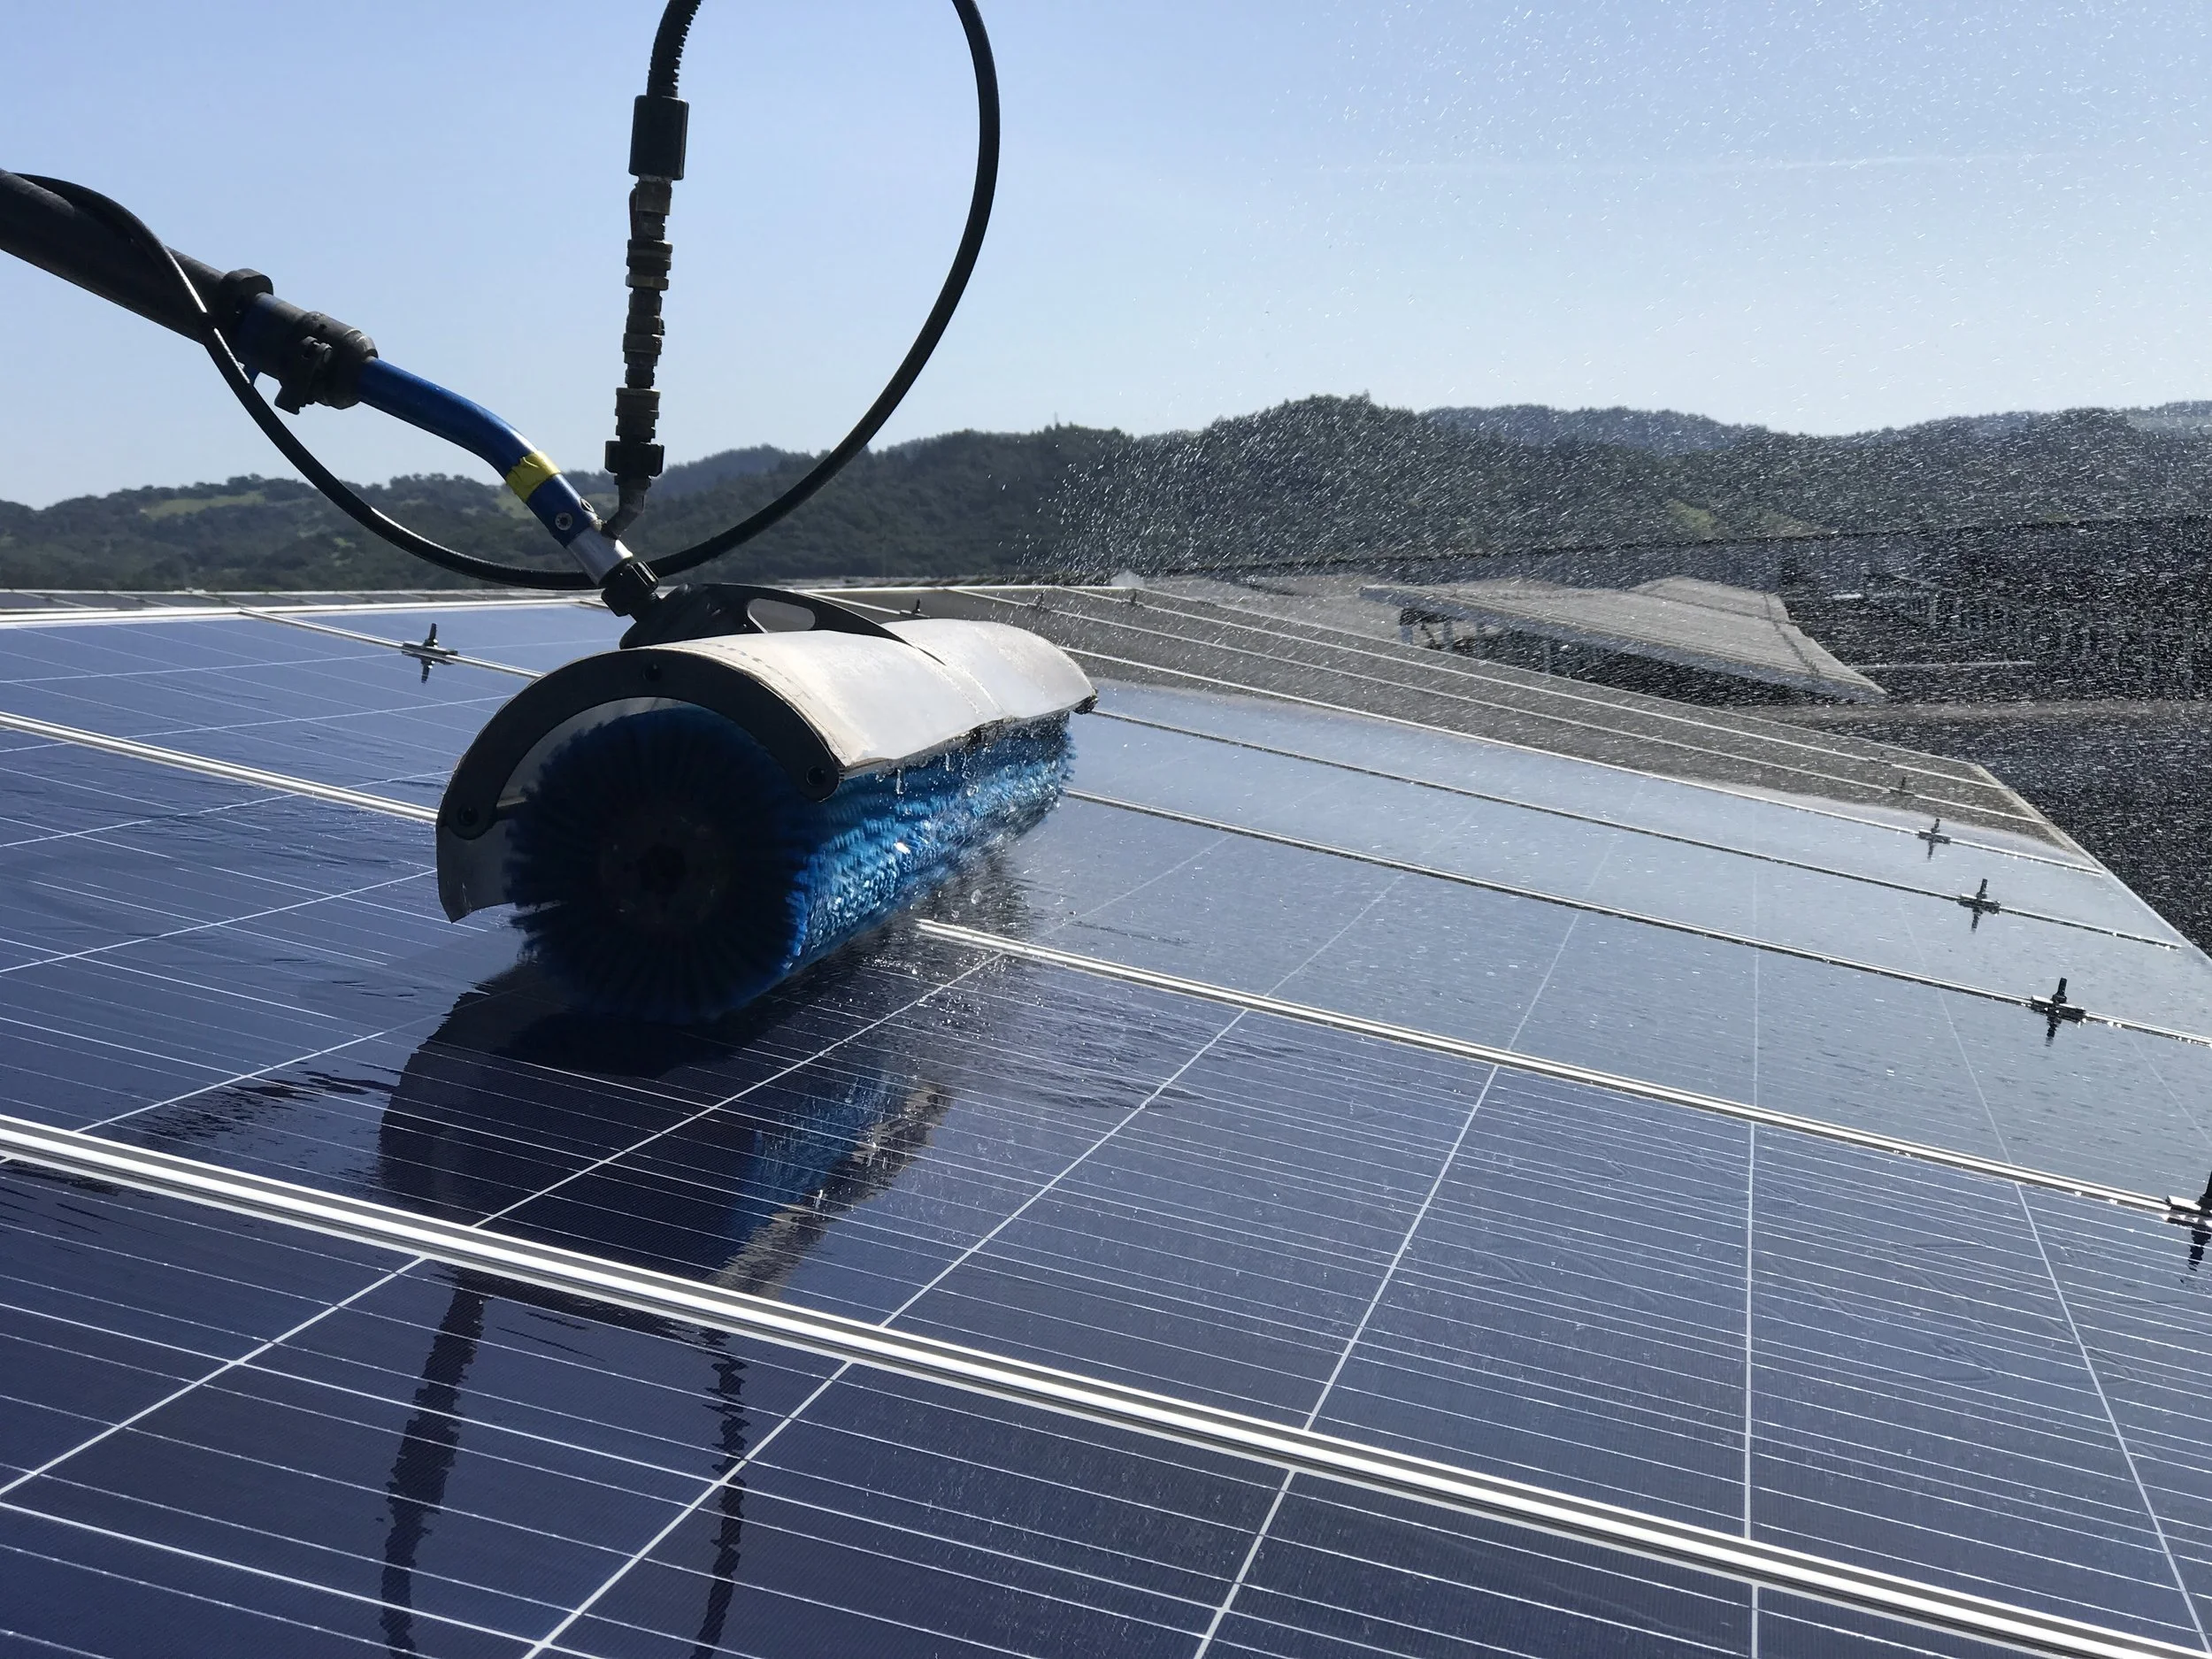
Energy / Water Management
Optimize resources for resilience
-
Certification & Reporting
Build trust and transparency
-

Project Implementation
Sustainability projects don’t always fit neatly into a box, so please reach out for interest in any custom projects.
Testimonials
-
![A young woman with curly black hair, wearing glasses, hoop earrings, and layered necklaces, smiling in an indoor setting with a blurred background.]()
Josh Prigge, Sustainability Consultant, Sustridge
I’ve had the privilege of working with Aaron for several years across multiple sustainability projects during his time at Jackson Family Wines and the IWCA. Aaron is exceptionally smart, thoughtful, and dedicated, combining deep technical expertise with a work ethic that consistently delivers results. He’s one of the most reliable and genuinely great people I’ve collaborated with, and I highly recommend him to any organization seeking top-tier sustainability consulting.
-
![]()
Erica Pann, Executive Director, Beverage Industry Environmental Roundtable
Aaron is one of the most thoughtful and technically rigorous sustainability professionals I’ve had the opportunity to work alongside. His deep expertise in sustainability within the wine industry sets him apart, but it’s his holistic approach that truly defines his impact. Aaron understands how environmental strategy, operational performance, and long-term business value intersect, and he brings that systems-level thinking to every engagement. He is also an incredibly collaborative partner, generous with his knowledge and committed to mentoring others along the way. Aaron genuinely believes that meaningful progress happens when we work together, and he consistently creates space for shared learning and practical, forward-looking solutions that move the industry and the planet toward a more sustainable future.
-
![Headshot of a smiling man with short brown hair and a beard, wearing a gray suit and white shirt against a light background.]()
Julien Gervreau, Sustainability Practice Leader, Sensiba LLP
Aaron is one of the most well-rounded sustainability professionals I’ve had the pleasure of working with in my career. He offers a great balance of deep technical expertise in sustainability management and is able to translate that into actionable insights for business leaders who are grappling with the challenge of how to implement these initiatives in the real world. -
![Charlotte Hey, Executive Director of International Wineries for Climate Action]()
Charlotte Hey, Executive Director, International Wineries for Climate Action
Aaron’s leadership, insight, and unwavering commitment to advancing climate action in the wine sector have been invaluable to our mission. His contributions strengthened IWCA’s governance and reinforced our collective drive toward measurable sustainability. We are deeply appreciative of his dedication and contribution to promoting carbon emission reduction in the broader wine community.
-
![Picture of Cameron Bard]()
Cameron Bard, Chief Revenue Officer, Madison Energy Infrastructure
I’ve had the privilege of collaborating with Aaron to drive clean energy projects forward for years now and cannot speak more highly of his tenacity, creativity, and attention to detail. Aaron brings a unique combination of research, market knowledge, and hands-on experience delivering renewable strategies and high-impact investments.
-
![Ryan Swanson headshot]()
Ryan Swanson, President, Enesfere Technologies
Since 2017, I have worked with Aaron on energy projects at six wineries. The projects include refrigeration and compressed air system tuning, solar PV installations, wastewater aeration upgrades, and thermal load shifting, among others. In each initiative, Aaron was the best manager and coordinator that one could ask for. He is truly committed to his profession, and he makes things happen.


Let’s work together
Frequently Asked Questions
-
We provide end-to-end sustainability consulting—from operational efficiency and GHG accounting to decarbonization planning, energy and water management, ESG reporting, and custom implementation projects. Every solution is tailored to your business goals and designed to deliver measurable impact.
-
Getting started is simple. Contact us through our form or send an email to aaron@sustysquared.com . We’ll assess your needs, outline next steps, and provide clarity on timelines, deliverables, and expected outcomes.
-
We combine deep technical expertise with a strategic, human-centered approach. Our work goes beyond compliance—we help you turn sustainability into a driver of innovation, resilience, and growth.
-
You can reach us anytime via our contact page or email at aaron@sustysquared.com. We aim to respond quickly—usually within one business day.
-
Pricing is project-based and reflects scope and complexity. After an initial consultation, we provide a transparent proposal with clear deliverables and no hidden costs.
-
Collaborative and results-driven. We guide the process, bring actionable insights, and keep projects moving—always with clear communication and measurable outcomes.
-
Yes. While we have deep expertise in wine and beverage, we also partner with tech firms, food producers, and other sectors facing sustainability challenges.
-
Absolutely. We design decarbonization roadmaps aligned with science-based targets and global frameworks like Race to Zero, ensuring your goals translate into actionable strategies.
-
Yes. We support recognized certifications and ESG reporting standards, including GRI and TCFD, to help you build credibility and transparency.
-
We thrive on unique challenges. From zero-waste packaging to water reuse systems, we design and implement tailored solutions that deliver environmental and financial impact.
-
Through data. Every engagement includes clear KPIs, baselines, and reporting to ensure progress is measurable and aligned with your business objectives.